Project Description
In this project, I will work with data from OKCupid, an online dating app. This dataset was provided to me by Codecademy as part of their “Data Science Career Path”. In this project I seek to accomplish the following:
- Visualize and explore OKCupid user data.
“Who uses OKCupid? What do people usually share on their profiles? How do people describe themselves?” - Use Supervised Machine Learning to predict gender.
“Can we train a gender classifier using the data? If yes, which features were the top predictors?” - Use Unsupervised Machine Learning to create dating pools.
“Can we narrow down your potential matches?”
This article outlines the accomplishment of the first objective. The continuation of this project is in separate articles:
Gender Classification with OKCupid Data
Dating Pools using K-Means Clustering
Work Skills showcased in this article:
- Ability to deal with a large dataset
- Clear communication of how data was received, cleaned, manipulated, visualized, and analyzed
- Data cleaning, wrangling, and manipulation with Pandas
- Parsing HTML with Beautiful Soup
- Static Data Visualization with Matplotlib and Seaborn
- Interactive Data Visualizations using Plotly
- Natural Language Processing using Natural Language Toolkit to convert text corpora into vectors
- Visualizing text corpora as wordclouds
- Exploratory Data Analysis
- Preprocessing Data to make it ready for Machine Learning
Let’s begin with inspection of the data.
Inspection
import pandas as pd
df = pd.read_csv('profiles.csv')
df.info()
<class 'pandas.core.frame.DataFrame'>
RangeIndex: 59946 entries, 0 to 59945
Data columns (total 31 columns):
 #   Column       Non-Null Count  Dtype
---  ------       --------------  -----
 0   age          59946 non-null  int64
 1   body_type    54650 non-null  object
 2   diet         35551 non-null  object
 3   drinks       56961 non-null  object
 4   drugs        45866 non-null  object
 5   education    53318 non-null  object
 6   essay0       54458 non-null  object
 7   essay1       52374 non-null  object
 8   essay2       50308 non-null  object
 9   essay3       48470 non-null  object
 10  essay4       49409 non-null  object
 11  essay5       49096 non-null  object
 12  essay6       46175 non-null  object
 13  essay7       47495 non-null  object
 14  essay8       40721 non-null  object
 15  essay9       47343 non-null  object
 16  ethnicity    54266 non-null  object
 17  height       59943 non-null  float64
 18  income       59946 non-null  int64
 19  job          51748 non-null  object
 20  last_online  59946 non-null  object
 21  location     59946 non-null  object
 22  offspring    24385 non-null  object
 23  orientation  59946 non-null  object
 24  pets         40025 non-null  object
 25  religion     39720 non-null  object
 26  sex          59946 non-null  object
 27  sign         48890 non-null  object
 28  smokes       54434 non-null  object
 29  speaks       59896 non-null  object
 30  status       59946 non-null  object
dtypes: float64(1), int64(2), object(28)
memory usage: 14.2+ MB
- The sample size is 59,946
- There are 30 features to describe each user. Only three of the features are numeric, the rest are categorical or in text form.
- Not all users have complete data.
Let’s see how these feature values actually look like:
pd.set_option("display.max_columns", None)
df.head()
| age | body_type | diet | drinks | drugs | education | essay0 | essay1 | essay2 | essay3 | essay4 | essay5 | essay6 | essay7 | essay8 | essay9 | ethnicity | height | income | job | last_online | location | offspring | orientation | pets | religion | sex | sign | smokes | speaks | status | |
|---|---|---|---|---|---|---|---|---|---|---|---|---|---|---|---|---|---|---|---|---|---|---|---|---|---|---|---|---|---|---|---|
| 0 | 22 | a little extra | strictly anything | socially | never | working on college/university | about me:<br />\n<br />\ni would love to think... | currently working as an international agent fo... | making people laugh.<br />\nranting about a go... | the way i look. i am a six foot half asian, ha... | books:<br />\nabsurdistan, the republic, of mi... | food.<br />\nwater.<br />\ncell phone.<br />\n... | duality and humorous things | trying to find someone to hang out with. i am ... | i am new to california and looking for someone... | you want to be swept off your feet!<br />\nyou... | asian, white | 75.0 | -1 | transportation | 2012-06-28-20-30 | south san francisco, california | doesn’t have kids, but might want them | straight | likes dogs and likes cats | agnosticism and very serious about it | m | gemini | sometimes | english | single |
| 1 | 35 | average | mostly other | often | sometimes | working on space camp | i am a chef: this is what that means.<br />\n1... | dedicating everyday to being an unbelievable b... | being silly. having ridiculous amonts of fun w... | NaN | i am die hard christopher moore fan. i don't r... | delicious porkness in all of its glories.<br /... | NaN | NaN | i am very open and will share just about anyth... | NaN | white | 70.0 | 80000 | hospitality / travel | 2012-06-29-21-41 | oakland, california | doesn’t have kids, but might want them | straight | likes dogs and likes cats | agnosticism but not too serious about it | m | cancer | no | english (fluently), spanish (poorly), french (... | single |
| 2 | 38 | thin | anything | socially | NaN | graduated from masters program | i'm not ashamed of much, but writing public te... | i make nerdy software for musicians, artists, ... | improvising in different contexts. alternating... | my large jaw and large glasses are the physica... | okay this is where the cultural matrix gets so... | movement<br />\nconversation<br />\ncreation<b... | NaN | viewing. listening. dancing. talking. drinking... | when i was five years old, i was known as "the... | you are bright, open, intense, silly, ironic, ... | NaN | 68.0 | -1 | NaN | 2012-06-27-09-10 | san francisco, california | NaN | straight | has cats | NaN | m | pisces but it doesn’t matter | no | english, french, c++ | available |
| 3 | 23 | thin | vegetarian | socially | NaN | working on college/university | i work in a library and go to school. . . | reading things written by old dead people | playing synthesizers and organizing books acco... | socially awkward but i do my best | bataille, celine, beckett. . .<br />\nlynch, j... | NaN | cats and german philosophy | NaN | NaN | you feel so inclined. | white | 71.0 | 20000 | student | 2012-06-28-14-22 | berkeley, california | doesn’t want kids | straight | likes cats | NaN | m | pisces | no | english, german (poorly) | single |
| 4 | 29 | athletic | NaN | socially | never | graduated from college/university | hey how's it going? currently vague on the pro... | work work work work + play | creating imagery to look at:<br />\nhttp://bag... | i smile a lot and my inquisitive nature | music: bands, rappers, musicians<br />\nat the... | NaN | NaN | NaN | NaN | NaN | asian, black, other | 66.0 | -1 | artistic / musical / writer | 2012-06-27-21-26 | san francisco, california | NaN | straight | likes dogs and likes cats | NaN | m | aquarius | no | english | single |
- The
incomecolumn has values of -1 to signify missing values. The other columns make use of NaN. - We cannot properly see the ‘essays’ in a tabular display.
- The
last_onlinecolumn has values from the year 2012. - Some of the columns can actually be split up. For example, with the field
religion, instead of a value being ‘agnosticism and very serious about it”, we can have {‘religion’: ‘agnosticism’} and {‘religion_seriousness’: ‘very serious about it’}.
To get a proper idea of the essay columns, let’s print out a single user’s data.
def show_user_data(df, index):
    '''Takes a row index and prints out all the features of that index'''
    for each, col in zip(df.iloc[index], df.columns):
        print('\033[1m' + col + ':' + '\033[0m' + ' ' + str(each))
show_user_data(df, 0)
age: 22
body_type: a little extra
diet: strictly anything
drinks: socially
drugs: never
education: working on college/university
essay0: about me:<br />
<br />
i would love to think that i was some some kind of intellectual:
either the dumbest smart guy, or the smartest dumb guy. can't say i
can tell the difference. i love to talk about ideas and concepts. i
forge odd metaphors instead of reciting cliches. like the
simularities between a friend of mine's house and an underwater
salt mine. my favorite word is salt by the way (weird choice i
know). to me most things in life are better as metaphors. i seek to
make myself a little better everyday, in some productively lazy
way. got tired of tying my shoes. considered hiring a five year
old, but would probably have to tie both of our shoes... decided to
only wear leather shoes dress shoes.<br />
<br />
about you:<br />
<br />
you love to have really serious, really deep conversations about
really silly stuff. you have to be willing to snap me out of a
light hearted rant with a kiss. you don't have to be funny, but you
have to be able to make me laugh. you should be able to bend spoons
with your mind, and telepathically make me smile while i am still
at work. you should love life, and be cool with just letting the
wind blow. extra points for reading all this and guessing my
favorite video game (no hints given yet). and lastly you have a
good attention span.
essay1: currently working as an international agent for a freight
forwarding company. import, export, domestic you know the
works.<br />
online classes and trying to better myself in my free time. perhaps
a hours worth of a good book or a video game on a lazy sunday.
essay2: making people laugh.<br />
ranting about a good salting.<br />
finding simplicity in complexity, and complexity in simplicity.
essay3: the way i look. i am a six foot half asian, half caucasian mutt. it
makes it tough not to notice me, and for me to blend in.
essay4: books:<br />
absurdistan, the republic, of mice and men (only book that made me
want to cry), catcher in the rye, the prince.<br />
<br />
movies:<br />
gladiator, operation valkyrie, the producers, down periscope.<br />
<br />
shows:<br />
the borgia, arrested development, game of thrones, monty
python<br />
<br />
music:<br />
aesop rock, hail mary mallon, george thorogood and the delaware
destroyers, felt<br />
<br />
food:<br />
i'm down for anything.
essay5: food.<br />
water.<br />
cell phone.<br />
shelter.
essay6: duality and humorous things
essay7: trying to find someone to hang out with. i am down for anything
except a club.
essay8: i am new to california and looking for someone to wisper my secrets
to.
essay9: you want to be swept off your feet!<br />
you are tired of the norm.<br />
you want to catch a coffee or a bite.<br />
or if you want to talk philosophy.
ethnicity: asian, white
height: 75.0
income: -1
job: transportation
last_online: 2012-06-28-20-30
location: south san francisco, california
offspring: doesn’t have kids, but might want them
orientation: straight
pets: likes dogs and likes cats
religion: agnosticism and very serious about it
sex: m
sign: gemini
smokes: sometimes
speaks: english
status: single
- The text data is formatted as HTML. This can be converted to normal text using an HTML Parser and Regex.
- The unstructured text data of the essay questions should probably be analyzed using Natural Language Processing.
To find out how long ago this sample was taken, let’s look at the range of values of last_online.
print(df.last_online.min())
print(df.last_online.max())
2011-06-27-01-52
2012-07-01-08-57
It turns out that this data is very old. We can only make inference about OKCupid’s users during the year 2012!
Finally, before doing anything to the data, let’s see which features have missing values.
import missingno as msno
msno.matrix(df)
print('Missing values per column')
nulls = [(df[feature].isnull().sum(), feature) for feature in df.columns]
print(sorted(nulls))
Missing values per column
[(0, 'age'), (0, 'income'), (0, 'last_online'), (0, 'location'), (0, 'orientation'), (0, 'sex'), (0, 'status'), (3, 'height'), (50, 'speaks'), (2985, 'drinks'), (5296, 'body_type'), (5488, 'essay0'), (5512, 'smokes'), (5680, 'ethnicity'), (6628, 'education'), (7572, 'essay1'), (8198, 'job'), (9638, 'essay2'), (10537, 'essay4'), (10850, 'essay5'), (11056, 'sign'), (11476, 'essay3'), (12451, 'essay7'), (12603, 'essay9'), (13771, 'essay6'), (14080, 'drugs'), (19225, 'essay8'), (19921, 'pets'), (20226, 'religion'), (24395, 'diet'), (35561, 'offspring')]
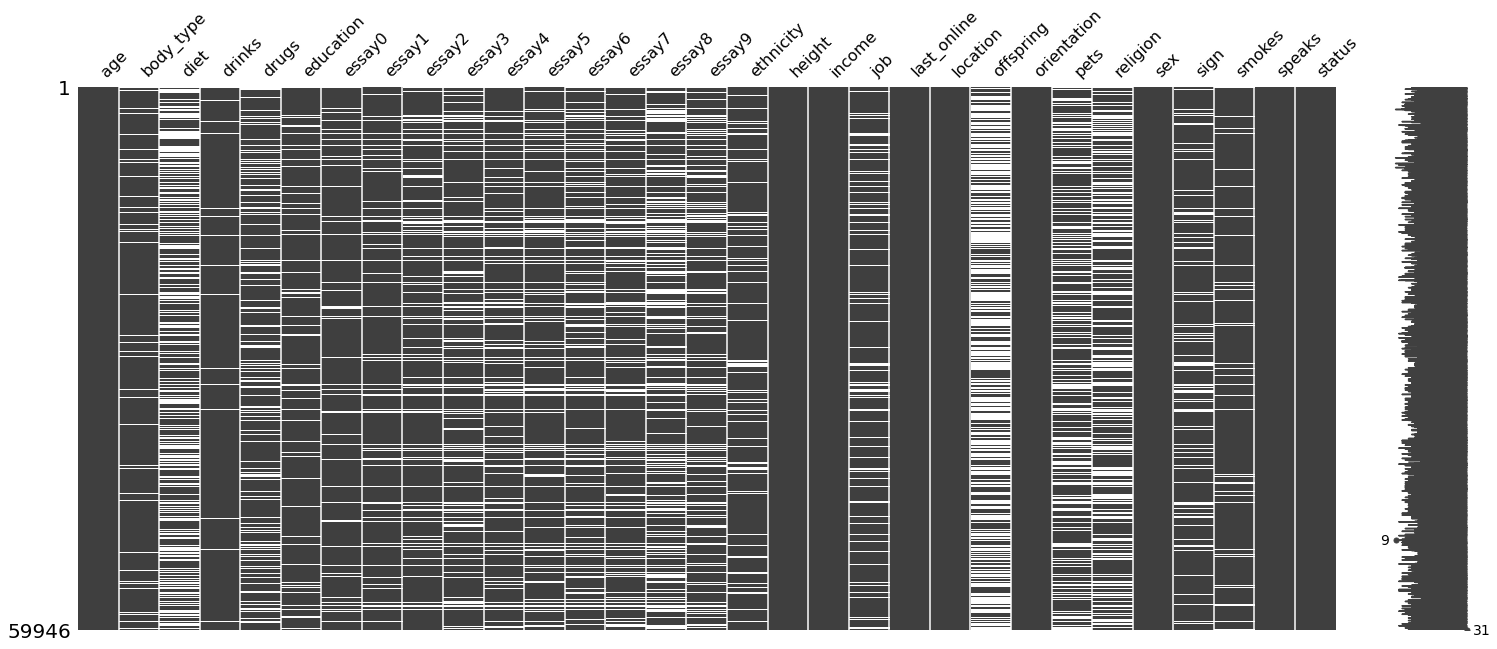
- The
incomecolumn is shown as having no missing values, but in reality it has missing values encoded as -1. - Some columns such as
age,height,orientation, have no missing values, whereas most of the other columns do have missing values. This means that when a user signs up for OKCupid there are required and optional fields for the user to fill.
Inspection Recap
In this section we have learned the following:
- The sample size is 59,946.
- There are 30 features to describe each user, 3 of which are numeric, the rest are categorical or text.
- Users were given Optional and Required fields upon signing up. A lot of users do not supply complete data.
- The
incomecolumn uses -1 as its placeholder for missing data. - This data sample was collected from the year 2012.
- The text data is formatted as HTML.
- The essay questions are good candidates for analysis using Natural Language Processing.
- Some of the columns can be split up to give us more features.
Cleaning and Tidying
The data has to be cleaned and preprocessed before it can be analyzed. Let’s start with replacing all the -1 in the income field with NaN, the null value recognized by Pandas and NumPy.
import numpy as np
df.income.replace(-1, np.nan, inplace = True)
We can reinspect the missing values visualization to confirm the replacement of the null values.
msno.matrix(df)
print('Missing values per column')
nulls = [(df[feature].isnull().sum(), feature) for feature in df.columns]
print(sorted(nulls))
Missing values per column
[(0, 'age'), (0, 'last_online'), (0, 'location'), (0, 'orientation'), (0, 'sex'), (0, 'status'), (3, 'height'), (50, 'speaks'), (2985, 'drinks'), (5296, 'body_type'), (5488, 'essay0'), (5512, 'smokes'), (5680, 'ethnicity'), (6628, 'education'), (7572, 'essay1'), (8198, 'job'), (9638, 'essay2'), (10537, 'essay4'), (10850, 'essay5'), (11056, 'sign'), (11476, 'essay3'), (12451, 'essay7'), (12603, 'essay9'), (13771, 'essay6'), (14080, 'drugs'), (19225, 'essay8'), (19921, 'pets'), (20226, 'religion'), (24395, 'diet'), (35561, 'offspring'), (48442, 'income')]
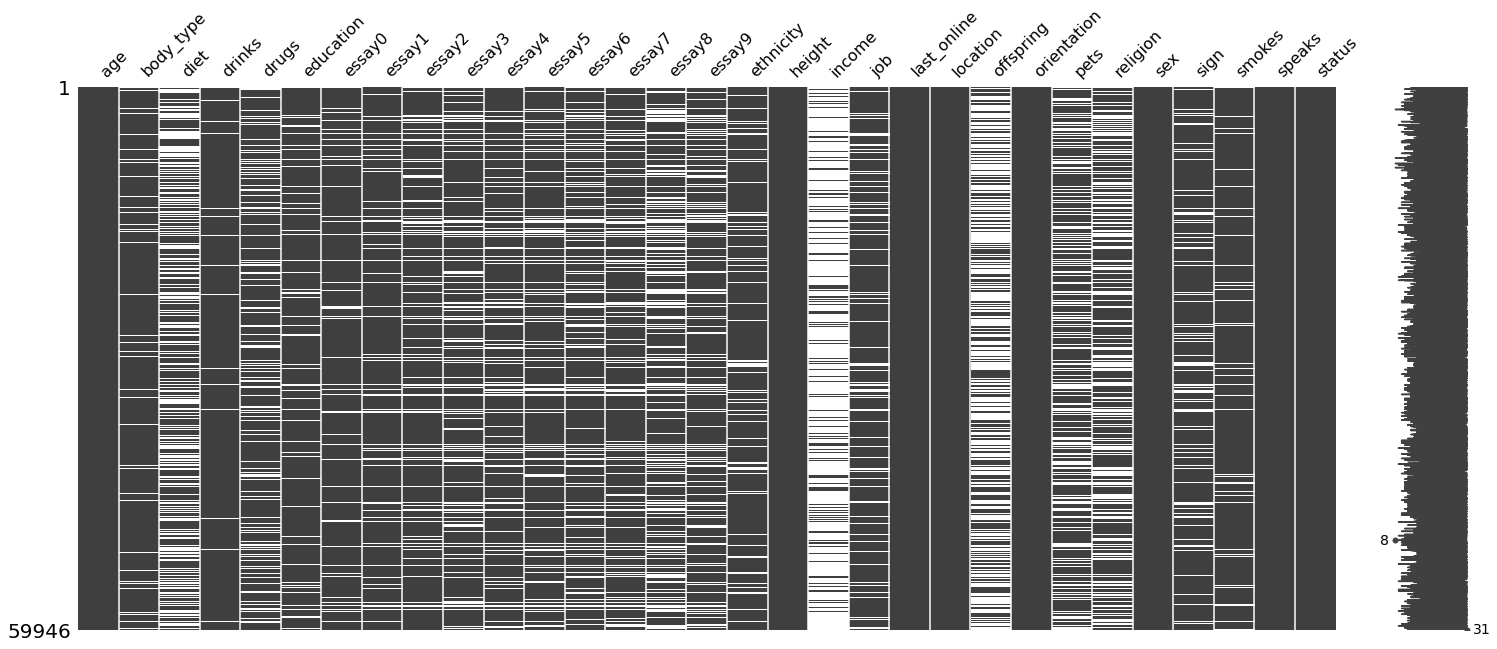
It appears that income is one of the pieces of information that people would least like to share. Later on, we could make a detailed comparison of the percentage of missing values of each column to evaluate “willingness of users to share information”.
Let’s move on to the HTML formatted text data. Not only is it more difficult to read, it is also not suitable for Natural Language Processing. Let’s clean up the text using an HTML Parser and Regex. Let’s try it out on a single entry first.
from bs4 import BeautifulSoup
import re

#Create html_parser function
def html_parser(raw_html):
    raw_html = str(raw_html)
    soup = BeautifulSoup(raw_html, 'html.parser')
    soup_string = soup.get_text()
    soup_string = re.sub('<.*>', ' ', soup_string)
    return soup_string
Before:
print(df.essay9[0])
you want to be swept off your feet!<br />
you are tired of the norm.<br />
you want to catch a coffee or a bite.<br />
or if you want to talk philosophy.
After:
print(html_parser(df.essay9[0]))
you want to be swept off your feet!
you are tired of the norm.
you want to catch a coffee or a bite.
or if you want to talk philosophy.
Now let’s apply this to all of the text in the data.
#Takes a few minutes - Parse all the raw HTML in the data

import warnings
warnings.filterwarnings('ignore')

object_cols = [series for series in df.columns if df[series].dtype == 'O']
for series in object_cols:
    df[series] = df[series].apply(lambda row: html_parser(row) if pd.notnull(row) else row)

# warnings.resetwarnings()
Lots of warnings given, mostly because users are including YouTube URLs and external links. It’s good to be made aware, as the URLs could affect the analysis later.
Cleaning Recap
In this section, we accomplished the following:
- The -1 values of income have been replaced with
NaN, making it consistent with the null placeholders used by the other columns, and recognized by Pandas and NumPy. - All HTML formatted text has been converted to normal, readable text. A caveat though is that it still includes
\n, the carriage return symbol, which is parsed by python when the text is input to theprint()function.
Feature Engineering
We can visualize and explore additional details by producing more columns from our existing ones. The addition of more columns, also called features, is feature engineering.
Let’s back up the dataframe in its current form, so that even after modification and addition of columns, we can easily refer to the original data if necessary.
original_df_backup = df.copy(deep = True)
Splitting Columns
We can produce new features by splitting the existing ones. Some of our features are actually describing two variables that are potentially independent of each other.
Splitting various columns into two
def two_split_columns(delimiter, df, feature, col1_name, col2_name, swap = False, stringify_None = False, strip = False):
    '''splits a column into two. Takes a delimiter, DataFrame, and Series name'''
    new = df[feature].str.split(delimiter, n = 1, expand = True)
    if swap:
        new[1] = new.apply(lambda row: row[0] if not(isinstance(row[1], str)) else row[1], axis = 1)
        new[0] = new.apply(lambda row: '[No Prefix]' if row[0] == row[1] else row[0], axis = 1)
    if stringify_None:
        new[1] = new[1].apply(lambda col: 'None' if col is None else col)
        new[0] = new[0].apply(lambda col: 'None' if col is None else col)
    if strip:
        new[1] = new[1].apply(lambda col: col.strip() if isinstance(col, str) else col)
        new[0] = new[0].apply(lambda col: col.strip() if isinstance(col, str) else col)
    df[col1_name]= new[0]
    df[col2_name]= new[1]
    return new

two_split_columns(" ", df, "diet", "diet_adherence", "diet_type", True)
two_split_columns(",", df, "location", "city", "state/country")
two_split_columns(",", df, "offspring", "offspring_want", "offspring_attitude", False, False)
##Religion
df['temp'] = df['religion'].apply(lambda col: col.replace("but", "and") if isinstance(col, str) else col)
two_split_columns("and", df, "temp", "religion_type", "religion_attitude", stringify_None = True, strip = True)
del df['temp']
## Sign
df['temp'] = df['sign'].apply(lambda col: col.replace("but", "and") if isinstance(col, str) else col)
two_split_columns("and", df, "temp", "sign_type", "sign_attitude", stringify_None = True, strip = True)
del df['temp']
Columns split in two:
| Original Feature | New Feature 1 | New Feature 2 |
|---|---|---|
| diet | diet_adherence | diet_type |
| location | city | state |
| offspring | offspring_want | offspring_attitude |
| religion | religion_type | religion_attitude |
| sign | sign_type | sign_attitude |
Splitting pets
There are really two kinds of pets among the values: dogs and cats. Let’s proceed by splitting pets into ‘dogs’ and ‘cats’.
temp = two_split_columns("and", df, "pets", "dogs", "cats", False, False, strip = True)
temp[1] = temp.apply(lambda row: row[0] if "cat" in str(row[0]) else row[1], axis = 1)
temp[0] = temp.apply(lambda row: None if "cat" in str(row[0]) else row[0], axis = 1)
df["dogs"] = temp[0]
df["cats"] = temp[1]
Having a pet can have nothing to do with liking a pet. Let’s further split this into dog_preference, has_dogs, cat_preference, has_cats. Let’s also remove dogs and cats.
df['dog_preference'] = df.apply(lambda row: row['dogs'] if "like" in str(row['dogs']) else None, axis = 1)
df['cat_preference'] = df.apply(lambda row: row['cats'] if "like" in str(row['cats']) else None, axis = 1)
df['has_dogs'] =  df.apply(lambda row: 1 if "has" in str(row['dogs']) else 0, axis = 1)
df['has_dogs'] =  df.apply(lambda row: row['has_dogs'] if isinstance(row['pets'], str) else None, axis = 1)
df['has_cats'] =  df.apply(lambda row: 1 if "has" in str(row['cats']) else 0, axis = 1)
df['has_cats'] =  df.apply(lambda row: row['has_cats'] if isinstance(row['pets'], str) else None, axis = 1)
del df['dogs']
del df['cats']
df[['dog_preference', 'has_dogs', 'cat_preference', 'has_cats']].head()
| dog_preference | has_dogs | cat_preference | has_cats | |
|---|---|---|---|---|
| 0 | likes dogs | 0.0 | likes cats | 0.0 |
| 1 | likes dogs | 0.0 | likes cats | 0.0 |
| 2 | None | 0.0 | None | 1.0 |
| 3 | None | 0.0 | likes cats | 0.0 |
| 4 | likes dogs | 0.0 | likes cats | 0.0 |
Splitting speaks
There’s quite some unpacking that needs to be done here. There appear to be several different languages and different options for fluency. Before we start making new columns, let’s get a better sense for what exactly our values are.
languages = df.speaks.value_counts()
languages = languages.index
languages = [each.split(',') for each in languages]
languages = [item for sublist in languages for item in sublist]
languages = set([each.strip() for each in languages])
temp = languages
languages = [each.split(" (") for each in languages]
languages = [each[0] for each in languages]
languages = sorted(set(languages))
print("There are {} different language options:".format(len(languages)))
print(languages)
print("There are 4 different fluency options per language:")
print(sorted(temp)[:4])
There are 77 different language options:
['afrikaans', 'albanian', 'ancient greek', 'arabic', 'armenian', 'basque', 'belarusan', 'bengali', 'breton', 'bulgarian', 'c++', 'catalan', 'cebuano', 'chechen', 'chinese', 'croatian', 'czech', 'danish', 'dutch', 'english', 'esperanto', 'estonian', 'farsi', 'finnish', 'french', 'frisian', 'georgian', 'german', 'greek', 'gujarati', 'hawaiian', 'hebrew', 'hindi', 'hungarian', 'icelandic', 'ilongo', 'indonesian', 'irish', 'italian', 'japanese', 'khmer', 'korean', 'latin', 'latvian', 'lisp', 'lithuanian', 'malay', 'maori', 'mongolian', 'norwegian', 'occitan', 'other', 'persian', 'polish', 'portuguese', 'romanian', 'rotuman', 'russian', 'sanskrit', 'sardinian', 'serbian', 'sign language', 'slovak', 'slovenian', 'spanish', 'swahili', 'swedish', 'tagalog', 'tamil', 'thai', 'tibetan', 'turkish', 'ukrainian', 'urdu', 'vietnamese', 'welsh', 'yiddish']
There are 4 different fluency options per language:
['afrikaans', 'afrikaans (fluently)', 'afrikaans (okay)', 'afrikaans (poorly)']
After isolation of terms it is revealed that among the speaks values there are 77 different languages and four different descriptors of language fluency. The ambiguity of the fluency options presents a dilemma. What is ‘afrikaans’ supposed to mean compared to ‘afrikaans (okay)’? Because of this ambiguity, we will not make use of the fluency descriptors in our visualization. We will create a new column for each language containing a 1 to indicate if the language is spoken, 0 if not. The result is actually called a sparse matrix. ‘Sparse’ because it contains much more 0s than 1s.
#Takes a few minutes
for language in languages:
    df[language] = df.apply(lambda row: 1 if (language in str(row['speaks'])) else 0, axis = 1)
df[languages].head(3)
| afrikaans | albanian | ancient greek | arabic | armenian | basque | belarusan | bengali | breton | bulgarian | c++ | catalan | cebuano | chechen | chinese | croatian | czech | danish | dutch | english | esperanto | estonian | farsi | finnish | french | frisian | georgian | german | greek | gujarati | hawaiian | hebrew | hindi | hungarian | icelandic | ilongo | indonesian | irish | italian | japanese | khmer | korean | latin | latvian | lisp | lithuanian | malay | maori | mongolian | norwegian | occitan | other | persian | polish | portuguese | romanian | rotuman | russian | sanskrit | sardinian | serbian | sign language | slovak | slovenian | spanish | swahili | swedish | tagalog | tamil | thai | tibetan | turkish | ukrainian | urdu | vietnamese | welsh | yiddish | |
|---|---|---|---|---|---|---|---|---|---|---|---|---|---|---|---|---|---|---|---|---|---|---|---|---|---|---|---|---|---|---|---|---|---|---|---|---|---|---|---|---|---|---|---|---|---|---|---|---|---|---|---|---|---|---|---|---|---|---|---|---|---|---|---|---|---|---|---|---|---|---|---|---|---|---|---|---|---|
| 0 | 0 | 0 | 0 | 0 | 0 | 0 | 0 | 0 | 0 | 0 | 0 | 0 | 0 | 0 | 0 | 0 | 0 | 0 | 0 | 1 | 0 | 0 | 0 | 0 | 0 | 0 | 0 | 0 | 0 | 0 | 0 | 0 | 0 | 0 | 0 | 0 | 0 | 0 | 0 | 0 | 0 | 0 | 0 | 0 | 0 | 0 | 0 | 0 | 0 | 0 | 0 | 0 | 0 | 0 | 0 | 0 | 0 | 0 | 0 | 0 | 0 | 0 | 0 | 0 | 0 | 0 | 0 | 0 | 0 | 0 | 0 | 0 | 0 | 0 | 0 | 0 | 0 |
| 1 | 0 | 0 | 0 | 0 | 0 | 0 | 0 | 0 | 0 | 0 | 0 | 0 | 0 | 0 | 0 | 0 | 0 | 0 | 0 | 1 | 0 | 0 | 0 | 0 | 1 | 0 | 0 | 0 | 0 | 0 | 0 | 0 | 0 | 0 | 0 | 0 | 0 | 0 | 0 | 0 | 0 | 0 | 0 | 0 | 0 | 0 | 0 | 0 | 0 | 0 | 0 | 0 | 0 | 0 | 0 | 0 | 0 | 0 | 0 | 0 | 0 | 0 | 0 | 0 | 1 | 0 | 0 | 0 | 0 | 0 | 0 | 0 | 0 | 0 | 0 | 0 | 0 |
| 2 | 0 | 0 | 0 | 0 | 0 | 0 | 0 | 0 | 0 | 0 | 1 | 0 | 0 | 0 | 0 | 0 | 0 | 0 | 0 | 1 | 0 | 0 | 0 | 0 | 1 | 0 | 0 | 0 | 0 | 0 | 0 | 0 | 0 | 0 | 0 | 0 | 0 | 0 | 0 | 0 | 0 | 0 | 0 | 0 | 0 | 0 | 0 | 0 | 0 | 0 | 0 | 0 | 0 | 0 | 0 | 0 | 0 | 0 | 0 | 0 | 0 | 0 | 0 | 0 | 0 | 0 | 0 | 0 | 0 | 0 | 0 | 0 | 0 | 0 | 0 | 0 | 0 |
Let’s check the memory being used up by the sparse matrix.
#Credit where credit is due: Function from Dafni Sidiropoulou Velidou's article "Working with sparse data sets in pandas and sklearn"
BYTES_TO_MB_DIV = 0.000001
def print_memory_usage_of_data_frame(df):
    mem = round(df.memory_usage().sum() * BYTES_TO_MB_DIV, 3)
    print("Memory usage is " + str(mem) + " MB")

print_memory_usage_of_data_frame(df[languages])
Memory usage is 36.927 MB
Converting our sparse matrix to a Pandas Sparse Array reduces its memory usage.
temp = df[languages].copy()
for (columnName, columnData) in temp.iteritems():
    df[columnName] = pd.arrays.SparseArray(columnData.values, dtype='uint8')

print_memory_usage_of_data_frame(df[languages])
Memory usage is 0.553 MB
Adding columns
There are other ways to derive new features in addition to splitting.
temp = df['ethnicity'].apply(lambda col: col.split(",") if isinstance(col, str) else col)
df['num_ethnicities'] = temp.apply(lambda col: len(col) if isinstance(col, list) else col)
df['optional_%unfilled'] = ((original_df_backup.isnull().sum(axis = 1))/24) * 100
df['num_languages'] = df[languages].sum(axis = 1).replace(0, None)
Added Columns:
| New Feature | Description |
|---|---|
| num_ethnicities | Contains the number of ethnicities listed in ‘ethnicity’ |
| optional_%unfilled | Percentage of optional fields unfilled |
| num_languages | Count of languages spoken |
Feature Engineering Recap
In this section, we accomplished the following:
- We split several columns into two.
- We split
petsintodog_preference,has_dogs,cat_preference,has_cats. - We expanded
speaksinto a sparse matrix where each column is a language and each row value is 1 or 0. - We added
num_ethnicities,optional_%unfilled,num_languages.
Visualization
Numerical Features
The best way to explore data is to visualize it. Let’s start by generating histograms and boxplots of our numerical features.
import plotly.express as px

selection = ['age', 'height', 'income', 'optional_%unfilled']
fig = px.histogram(df, x = selection, marginal = 'box', histnorm = 'percent').update_traces(visible = False, showlegend=False)
fig.data[0].visible = True
fig.data[1].visible = True

def create_button(column):
    temp = []
    for each in selection:
        temp.append(each == column)
        temp.append(each == column)
    return dict(
                args=[{"visible": temp}],
                label=column,
                method="update"
                )

fig.update_layout(
    title = "2012 OKCupid Profiles",
    updatemenus=[
        #Add a dropdown selector
        dict(
            buttons = [create_button(column) for column in selection],
            direction="down",
            pad={"r": 10, "t": 10},
            showactive=True,
        )

    ]
)
fig.show()
Use the dropdown selector to switch between features. Datapoints show more information on mouseover. The graph can be panned and zoomed.
| Feature | Comment |
|---|---|
| Age | The median age is 30. The distribution is right-skewed. Most users are young and working adults. |
| Height | Most heights range between 59 and 78 in (4.9 - 6.5 ft) with a median of 68in(5.67ft). The distribution appears normal. |
| Income | The median income is $50k. A quarter of all incomes are $25k. Most income distributions are log-normal (if the ultra-wealthy are not included), and this is no different. |
| All Features Above | From the box plot, we can see that all of the distributions have outliers - There is a 4.5% group of $1M earners. There are two people over 100 years old. There is a height of 1 inch. Below, we will inspect these data points (user profiles) to see what’s really going on. |
| optional_%unfilled | The y-axis shows the percentage of users and the x-axis shows the percentage of optional user information fields left unfilled. Interquartile Range is 12% - 30%, meaning half of all users don’t bother to fill 12% - 30% of optional fields. A quarter of users are below that range and a quarter of users are above that range. This is a feature that was engineered from the given raw data. |
Outlier Inspection
Age
Let’s look a look at the profiles of our centennial users.
display(df.iloc[2512:2513])
display(df.iloc[25324:25325])
| age | body_type | diet | drinks | drugs | education | essay0 | essay1 | essay2 | essay3 | essay4 | essay5 | essay6 | essay7 | essay8 | essay9 | ethnicity | height | income | job | last_online | location | offspring | orientation | pets | religion | sex | sign | smokes | speaks | status | diet_adherence | diet_type | city | state/country | offspring_want | offspring_attitude | religion_type | religion_attitude | sign_type | sign_attitude | dog_preference | cat_preference | has_dogs | has_cats | afrikaans | albanian | ancient greek | arabic | armenian | basque | belarusan | bengali | breton | bulgarian | c++ | catalan | cebuano | chechen | chinese | croatian | czech | danish | dutch | english | esperanto | estonian | farsi | finnish | french | frisian | georgian | german | greek | gujarati | hawaiian | hebrew | hindi | hungarian | icelandic | ilongo | indonesian | irish | italian | japanese | khmer | korean | latin | latvian | lisp | lithuanian | malay | maori | mongolian | norwegian | occitan | other | persian | polish | portuguese | romanian | rotuman | russian | sanskrit | sardinian | serbian | sign language | slovak | slovenian | spanish | swahili | swedish | tagalog | tamil | thai | tibetan | turkish | ukrainian | urdu | vietnamese | welsh | yiddish | num_ethnicities | optional_%unfilled | num_languages | |
|---|---|---|---|---|---|---|---|---|---|---|---|---|---|---|---|---|---|---|---|---|---|---|---|---|---|---|---|---|---|---|---|---|---|---|---|---|---|---|---|---|---|---|---|---|---|---|---|---|---|---|---|---|---|---|---|---|---|---|---|---|---|---|---|---|---|---|---|---|---|---|---|---|---|---|---|---|---|---|---|---|---|---|---|---|---|---|---|---|---|---|---|---|---|---|---|---|---|---|---|---|---|---|---|---|---|---|---|---|---|---|---|---|---|---|---|---|---|---|---|---|---|---|---|---|---|
| 2512 | 110 | NaN | NaN | NaN | NaN | NaN | NaN | NaN | NaN | NaN | NaN | NaN | NaN | NaN | NaN | NaN | NaN | 67.0 | NaN | NaN | 2012-06-27-22-16 | daly city, california | NaN | straight | NaN | NaN | f | NaN | NaN | english | single | NaN | NaN | daly city | california | NaN | NaN | NaN | NaN | NaN | NaN | None | None | NaN | NaN | 0 | 0 | 0 | 0 | 0 | 0 | 0 | 0 | 0 | 0 | 0 | 0 | 0 | 0 | 0 | 0 | 0 | 0 | 0 | 1 | 0 | 0 | 0 | 0 | 0 | 0 | 0 | 0 | 0 | 0 | 0 | 0 | 0 | 0 | 0 | 0 | 0 | 0 | 0 | 0 | 0 | 0 | 0 | 0 | 0 | 0 | 0 | 0 | 0 | 0 | 0 | 0 | 0 | 0 | 0 | 0 | 0 | 0 | 0 | 0 | 0 | 0 | 0 | 0 | 0 | 0 | 0 | 0 | 0 | 0 | 0 | 0 | 0 | 0 | 0 | 0 | 0 | NaN | 95.833333 | 1 |
| age | body_type | diet | drinks | drugs | education | essay0 | essay1 | essay2 | essay3 | essay4 | essay5 | essay6 | essay7 | essay8 | essay9 | ethnicity | height | income | job | last_online | location | offspring | orientation | pets | religion | sex | sign | smokes | speaks | status | diet_adherence | diet_type | city | state/country | offspring_want | offspring_attitude | religion_type | religion_attitude | sign_type | sign_attitude | dog_preference | cat_preference | has_dogs | has_cats | afrikaans | albanian | ancient greek | arabic | armenian | basque | belarusan | bengali | breton | bulgarian | c++ | catalan | cebuano | chechen | chinese | croatian | czech | danish | dutch | english | esperanto | estonian | farsi | finnish | french | frisian | georgian | german | greek | gujarati | hawaiian | hebrew | hindi | hungarian | icelandic | ilongo | indonesian | irish | italian | japanese | khmer | korean | latin | latvian | lisp | lithuanian | malay | maori | mongolian | norwegian | occitan | other | persian | polish | portuguese | romanian | rotuman | russian | sanskrit | sardinian | serbian | sign language | slovak | slovenian | spanish | swahili | swedish | tagalog | tamil | thai | tibetan | turkish | ukrainian | urdu | vietnamese | welsh | yiddish | num_ethnicities | optional_%unfilled | num_languages | |
|---|---|---|---|---|---|---|---|---|---|---|---|---|---|---|---|---|---|---|---|---|---|---|---|---|---|---|---|---|---|---|---|---|---|---|---|---|---|---|---|---|---|---|---|---|---|---|---|---|---|---|---|---|---|---|---|---|---|---|---|---|---|---|---|---|---|---|---|---|---|---|---|---|---|---|---|---|---|---|---|---|---|---|---|---|---|---|---|---|---|---|---|---|---|---|---|---|---|---|---|---|---|---|---|---|---|---|---|---|---|---|---|---|---|---|---|---|---|---|---|---|---|---|---|---|---|
| 25324 | 109 | athletic | mostly other | NaN | never | working on masters program | NaN | NaN | NaN | nothing | NaN | NaN | NaN | NaN | NaN | NaN | NaN | 95.0 | NaN | student | 2012-06-30-18-18 | san francisco, california | might want kids | straight | NaN | other and somewhat serious about it | m | aquarius but it doesn’t matter | when drinking | english (okay) | available | mostly | other | san francisco | california | might want kids | None | other | somewhat serious about it | aquarius | it doesn’t matter | None | None | NaN | NaN | 0 | 0 | 0 | 0 | 0 | 0 | 0 | 0 | 0 | 0 | 0 | 0 | 0 | 0 | 0 | 0 | 0 | 0 | 0 | 1 | 0 | 0 | 0 | 0 | 0 | 0 | 0 | 0 | 0 | 0 | 0 | 0 | 0 | 0 | 0 | 0 | 0 | 0 | 0 | 0 | 0 | 0 | 0 | 0 | 0 | 0 | 0 | 0 | 0 | 0 | 0 | 0 | 0 | 0 | 0 | 0 | 0 | 0 | 0 | 0 | 0 | 0 | 0 | 0 | 0 | 0 | 0 | 0 | 0 | 0 | 0 | 0 | 0 | 0 | 0 | 0 | 0 | NaN | 54.166667 | 1 |
The first one has 95% unfilled optional fields. The second has 54% unfilled optional fields and a height of 95inches(8ft tall). Do you think these profiles are reliable?
Height
Below is an example of the kind of user profile which ‘has a height of 1 inch’.
show_user_data(df, 45959)
age: 36
body_type: nan
diet: nan
drinks: very often
drugs: never
education: graduated from college/university
essay0: i'm a transplant from southern california with roots in lovely
oakland. i find myself bored quite a bit. hence why i'm here. i
like whiskey and
find the term hipsters laughable yet amusing. the two
seem to go hand in hand around oaklands many dive bars. people
often describe me as "intense" or "stoic". i find either of those words
loaded and annoying. i have a gift for writing and although i take myself
pretty seriously, i don't take this online stuff too seriously. i'm
looking to find someone a little more burly than me who enjoys a
good day holding hands on the beach, whale watching and a fantastic
trip to the olive garden.

i am nerdcore, nice smelling, and a unique snowflake
essay1: living each day as if it'd be my last, and managing to hold down a
day-job in the process.

of course i'm going to make a crack at
wanting a quaint craftsman home in rockridge; complete with a white
picket fence, a loving wife (preferably not mail order), 2.5 kids,
and a green prius parked in the driveway.

with a pony...

just kidding.
essay2: writing, rambling, fixing anything thats breakable, photography.
drinking you under the table. traveling the road less traveled.
essay3: my otherwise perfect hair, my half-sleeve tattoo(s), my perfect
teeth i suppose. oh and my rather dry and snarky sense of humor.
essay4: i enjoy reading louis sachar, james burke, alan kaufman,hunter s.
thompson, chuck palahniuk for starters.

as far as music goes: i tend to listen to old and new punk with
bouts involving the classics:
frank sinatra
tom waits
frankie avalon
the misfits
crass
love and rockets
ugly ducklings
beastie boys
the vandals
propaghandi
minor threat
sonic youth
anything like old crusty-punk on stereophonic vinyl
you get the idea.

i noticed that its a very "hipster" thing to say that you don't own
or even like tv's when i actually own 2 *and* tivo. hows that for
going against the grain?

netflix, hulu and rapidshare are my best friend.
essay5: irish whiskey
broadband internet
my iphone
a decent pair of good fitting jeans
cheese
my needy and probably neurotic cat "peanut"
essay6: zombies, and ways not to get eaten by them.

my next big adventure
essay7: peering through the bottom of a whiskey glass.

perpetually rearranging my itunes playlist.

riding my iconic vintage peugeot fixed-gear conversion bicycle
uphill on a pbr run.

writing poetry in spiral patterns on napkins in various coffee
shops and giving them to complete strangers.
essay8: i can't stand online dating, or the stigma attached to it.
essay9: if you're a ninja (with skills) or a pirate. you're well mannered.
you're not a raging sociopath or a creeper. you like whiskey, you
know your whiskeys. you dont type like dis. and if you picked up on
the dry sarcasm , you should **definitely** message me.
ethnicity: nan
height: 1.0
income: 80000.0
job: science / tech / engineering
last_online: 2012-06-28-14-18
location: oakland, california
offspring: nan
orientation: straight
pets: likes dogs and has cats
religion: judaism and laughing about it
sex: m
sign: leo and it’s fun to think about
smokes: when drinking
speaks: english (fluently), c++ (fluently), hebrew (poorly), other (poorly)
status: single
diet_adherence: nan
diet_type: nan
city: oakland
state/country:  california
offspring_want: nan
offspring_attitude: nan
religion_type: judaism
religion_attitude: laughing about it
sign_type: leo
sign_attitude: it’s fun to think about
dog_preference: likes dogs
cat_preference: None
has_dogs: 0.0
has_cats: 1.0
afrikaans: 0
albanian: 0
ancient greek: 0
arabic: 0
armenian: 0
basque: 0
belarusan: 0
bengali: 0
breton: 0
bulgarian: 0
c++: 1
catalan: 0
cebuano: 0
chechen: 0
chinese: 0
croatian: 0
czech: 0
danish: 0
dutch: 0
english: 1
esperanto: 0
estonian: 0
farsi: 0
finnish: 0
french: 0
frisian: 0
georgian: 0
german: 0
greek: 0
gujarati: 0
hawaiian: 0
hebrew: 1
hindi: 0
hungarian: 0
icelandic: 0
ilongo: 0
indonesian: 0
irish: 0
italian: 0
japanese: 0
khmer: 0
korean: 0
latin: 0
latvian: 0
lisp: 0
lithuanian: 0
malay: 0
maori: 0
mongolian: 0
norwegian: 0
occitan: 0
other: 1
persian: 0
polish: 0
portuguese: 0
romanian: 0
rotuman: 0
russian: 0
sanskrit: 0
sardinian: 0
serbian: 0
sign language: 0
slovak: 0
slovenian: 0
spanish: 0
swahili: 0
swedish: 0
tagalog: 0
tamil: 0
thai: 0
tibetan: 0
turkish: 0
ukrainian: 0
urdu: 0
vietnamese: 0
welsh: 0
yiddish: 0
num_ethnicities: nan
optional_%unfilled: 16.666666666666664
num_languages: 4
Income
Below is the profile of someone who has an income of $1M.
show_user_data(df, 27590)
age: 32
body_type: fit
diet: anything
drinks: socially
drugs: never
education: graduated from space camp
essay0: update: okstupid removed my macbook "fun house mirror" effect
self-portrait, so you will no longer be able to see how hideously
disfigured i was in that photo. apparently, pictures of the back of
your head are o.k., but pictures taken with a slightly distorting
lens are not. is that how it works? i don't quite get it.

mi hermana hablas espanol sehr gut. aber yo hablo espanol solamente
en restorants.

por ehemplo:

"por favor, ocho tacos en dos platos para llevar. si, quatro y
quatro. quatro de asada y quatro de carnitas. con todo. si, para
llevar. yo already hablandoed that."

update: i am no longer eating cheap-ass tacos.

zdes' net russkoi klaviatury, tak chto, pridetsa popol'zovatsa
transliteracijej.

schas, posmotrim, chto napisal po-anglijskij, i perevozhu.

mm, da. ja javno byl nemnogo nedovolen etim saitom kogda pridumal
svoj username.

mne nravyatsa sobaki. mne nravitsa snowboarding. ya tol'ko nedavno
nachal chasto ezdit' snowboarding. v pozoproshlom sezone gde-to
10-12 dnei posnowboardal. a v proshlom sezone kak-to ne poluchilas'
- vsego 4-5 dnei snowboardal.
essay1: what's the point of winter? i mean in the mountains. i want to go
snowboarding
right now.
essay2: nothing. i suck at everything.

april 11th addendum: apparently my above opinion means i'm actually
good at everything, which is what people have been telling me. but
they're all incompetent (sp?).

http://www.zenspider.com/rwd/thoughts/inept.html

i enjoy long walks on the moon with my pet lap giraffe.
essay3: is that i'm there.
essay4: ich liebe gern nur rammstein.

du hast.

du hasst mich.

du hasst mich!

du hast mich gefragt. du hast mich gefragt. du hast mich
gefragt,
und ich hab nichts gesagt.

that song is so deep.

movies: universal soldier, big momma's house, norbit (or
anything
else with eddy murphy since about 1995), anything starring
kurt
russell (except captain ron and big trouble in little china).
species viii. jurassic park iv (straight to video). the 6th
element
(sequel to the 5th element, also straight to video, and
starring
milla jovovich's little sister, milla jovovich). 7th sense
(sequel
to 6th sense). ocean's 2.35 x 10^3(starring 800 cgi clones each
of
brad pittt, georgi cluni, and milla jovovich's little sister,
milla
jovovich). best movie ever: jordi laforge, the movie. i don't
think
i can list all my favorites. the list is just going too long.
anything with bill pullman, except spaceballs and independence
day
(wait... was there anything else?). etc.,etc.,et.,ce.t,c.,t

music: i can't tell you because if i list anything first it
will
seem like that's what i probably like most and will seem to
define
me as a particular character in your pop-culture dictionary.
i
don't watch t.v. and don't care if you do. i don't feel
self-important about it. but it also means i am much less
affected
by the minute-to-minute cultural updates in terminology and
opinions and events that inform the masses. i might not have
any
idea who your are talking about a lot of the time. i just listen
to
music that i like.

but i like [portishead], [led zeppelin],[bach],
blues, blues rock, some jazz, electronic music... whatever is
danceable and singable (i.e. more complex than a monotonous
repetitive beat).

books: haven't read much fiction lately. most fiction these
days
seems to be a sham. how many books were published last year?
compare that to the number of books worth reading that were
published in the 20th century. so, generally, if you avoid reading
new books you are probably avoiding bad books. there are many
proven masterpieces out there.

i liked the trial (kafka)a lot.
i like russian authors a lot (dead souls is one of the funniest
books i've ever read). i love funny books. [catch-22], some kurt
vonnegut. but
lately i have been reading more nonfiction.

and i much enjoyed the 10-15 [shakespeare] plays i've seen,
though
i've only read few.

i read [illiad] and [odyssey] last year. they are now two of
my favorite books. i tried to read the aeneid, but, i'm sorry,
it
just sucks. i think i managed to get through about 1/3 of it. the
epithets are less prevalent. the repeated phrases, like,
"dawn with her rose-red fingers..." that began many verses in
homer
and helped tie together his story are sorely lacking in
virgil's
[aeneid]. i thought that because it was translated by the
same
brilliant man, robert fagles, whose translations of homer i
read,
it would be just as good. apparently, a book's quality depends
on
more than just its translator.

this is funny to me:

 .  ,

     .

  : , , -
,
   ,
!
,  !


, , ,  ,
.
   ,   - ,

. , !   .  - ,
,
 ,       !
,
        ,

  ,
 ,     ,

    .   !
.
 ,  !    ,
,
,   ,  ! 1 , ,

      ,

   ,     .
,
,  ,       ,

 ,       ,

     .
,
     .
essay5: 1.) the layer of apprehension that intercedes between reality and
the perceiver.
2.) if perveiver isn't a word, then insert whatever word you
like.
c.) alphabet.
essay6: thinking about thinking.
essay7: may it never be typical.
essay8: is the stuff i wrote in the other sections. isn't that obvious?
essay9: you can't find any good reason not to.

or ...

if you want to help me finish off this johnnie walker, green label.
i'm not a big hard alcohol fan (i.e. not an alcoholic), but this
stuff is so good. and most times when it comes up, people think i'm
making it (green label) up, which i can understand. i used to be
really gullible when i was a kid. one kid in my class told me that
there was a super mario bros. 34 in japan and described all kinds
of awesome things you could do in it. japan is really futuristic,
and video games come out there decades before they do here. the wii
came out in the 1920's. so, i can understand why people might think
i'm pulling their leg(s). but now they can just check the internet
and see that i'm right. just don't check wikipedia, because i've
modified a few articles where i thought fact was less instructive
than fiction.

never mind, you're too late. i already finished it.
ethnicity: asian, middle eastern, black, native american, indian, pacific islander, hispanic / latin, white, other
height: 70.0
income: 1000000.0
job: science / tech / engineering
last_online: 2012-06-28-20-59
location: san francisco, california
offspring: nan
orientation: straight
pets: likes dogs
religion: nan
sex: m
sign: nan
smokes: no
speaks: english (fluently), russian (fluently), german (okay), french (okay), spanish (okay)
status: single
diet_adherence: [No Prefix]
diet_type: anything
city: san francisco
state/country:  california
offspring_want: nan
offspring_attitude: nan
religion_type: nan
religion_attitude: nan
sign_type: nan
sign_attitude: nan
dog_preference: likes dogs
cat_preference: None
has_dogs: 0.0
has_cats: 0.0
afrikaans: 0
albanian: 0
ancient greek: 0
arabic: 0
armenian: 0
basque: 0
belarusan: 0
bengali: 0
breton: 0
bulgarian: 0
c++: 0
catalan: 0
cebuano: 0
chechen: 0
chinese: 0
croatian: 0
czech: 0
danish: 0
dutch: 0
english: 1
esperanto: 0
estonian: 0
farsi: 0
finnish: 0
french: 1
frisian: 0
georgian: 0
german: 1
greek: 0
gujarati: 0
hawaiian: 0
hebrew: 0
hindi: 0
hungarian: 0
icelandic: 0
ilongo: 0
indonesian: 0
irish: 0
italian: 0
japanese: 0
khmer: 0
korean: 0
latin: 0
latvian: 0
lisp: 0
lithuanian: 0
malay: 0
maori: 0
mongolian: 0
norwegian: 0
occitan: 0
other: 0
persian: 0
polish: 0
portuguese: 0
romanian: 0
rotuman: 0
russian: 1
sanskrit: 0
sardinian: 0
serbian: 0
sign language: 0
slovak: 0
slovenian: 0
spanish: 1
swahili: 0
swedish: 0
tagalog: 0
tamil: 0
thai: 0
tibetan: 0
turkish: 0
ukrainian: 0
urdu: 0
vietnamese: 0
welsh: 0
yiddish: 0
num_ethnicities: 9.0
optional_%unfilled: 12.5
num_languages: 5
Graduated from space camp, complains about OKCupid picture takedown in essay0, nine ethnicities, five languages, 5’ 10” tall. Do you think this income is reliable?
Decision on Outliers
We will remove outliers for age and height. Outliers have the potential to greatly increase memory usage, variance, and training time. The current objective is to make a predictive model that works. If that objective is accomplished, we have the option of reiterating on this project to incorporate outliers. Please note that you should not automatically remove all outliers all the time. Treat outliers in each project on a case-to-case basis.
df = df[(df['height'] >= 57) & (df['height'] <= 80) & (df['age'] <= 69)]
Categorical Features
The code below produces an Interactive Treemap which has a dropdown selector that allows you to select which feature to visualize and a tickbox which lets you decide if you want to include null values. The actual interface is not available here because it requires an active python kernel to run. However, you can still see the interface in action via a GIF Image Preview. If you would like to use the interface yourself, open and run ‘Report_stable.ipynb’ from this project’s Github Repository.
from ipywidgets import interact, fixed

def make_treemap(df, feature, dropna):
    counts_table = df[feature].value_counts(normalize = True, dropna = dropna).reset_index()
    counts_table.rename(columns={feature: 'Percent'}, inplace = True)
    counts_table['Percent'] = counts_table['Percent'] * 100
    if dropna:
        names = 'index'
    else:
        names = counts_table['index'].apply(str)
    fig = px.treemap(
        counts_table,
        parents = [feature] * len(counts_table), #Need to define a tree root
        names = names,
        values = 'Percent',
        title = '2012 OKCupid Profiles',
        color = 'Percent',
        color_continuous_scale='Blues'
    )
    fig.update_traces(marker_showscale=False, texttemplate='%{label}<br>%{value:.2f%}%')
    fig.show()

essay_feats = ['essay0','essay1','essay2','essay3','essay4','essay5','essay6','essay7','essay8','essay9',]
numerical_feats = ['age', 'height', 'income']
drop_list = essay_feats + numerical_feats + ['last_online']
interact(make_treemap, df = fixed(df), feature = [each for each in df.columns if each not in drop_list], dropna = False)
GIF Image Preview
Donut Plots
print('**Nan represents unfilled/unshared optional information, \
signifiying that a user has not shared the\n respective information with OKCupid and it\'s missing from their profile')
print('\033[1m'+'*Extrapolated or split from raw data variables'+'\033[0m')
import matplotlib.pyplot as plt

drop = ['diet', 'diet_adherence', 'location', 'offspring_want', 'offspring_attitude', 'pets', 'religion', 'sign', 'speaks',
        'religion_attitude', 'sign_attitude', 'optional_%unfilled',
        'last_online'] + languages + ['age', 'height', 'income'] + essay_feats
for_plotting = df.drop(columns = drop).columns.to_list()
extrapolated_vars = ['diet_type', 'city', 'state/country', 'religion_type', 'sign_type',
                     'dog_preference', 'has_dogs', 'cat_preference', 'has_cats', 'num_ethnicities', 'num_languages']

def collapse_category(feat, threshold):
    '''Needed to ensure that only a mask would be used to mark categories to collapse,
    and to preserve the original data frame'''
    sum = df[feat].value_counts(dropna = False).reset_index()[feat].sum()
    temp = df[feat].copy()
    mask1 = temp.value_counts()/sum < threshold
    mask2 = temp.isin(mask1[mask1 == True].index)
    temp[mask2] = 'other'
    return temp.value_counts(dropna = False).reset_index()


for i in range(1, 12):
    plt.figure(figsize = (16, 9))
    j = 2*i
    k = j-2
    for num, feat in zip(range(1,3), for_plotting[k:j]):
        plt.subplot(1, 2, num)
        temp = collapse_category(feat, 0.01)
        labels = temp['index']
        theme = plt.get_cmap("tab20" if len(labels) > 10 else "tab10")
        plt.pie(x=temp[feat], autopct="%.1f%%", labels=labels, pctdistance=0.77,
                #radius = 1,
                colors = theme(np.arange(len(labels))),
                wedgeprops=dict(width=0.10,
                                edgecolor="k",
                                linewidth=0.7))
        text = feat + '*' if feat in extrapolated_vars else feat
        plt.text(0, 0, text,
                 horizontalalignment = 'center',
                 verticalalignment = 'center',
                 fontsize = 20)
    plt.show()
    plt.clf()
**Nan represents unfilled/unshared optional information, signifiying that a user has not shared the
 respective information with OKCupid and it's missing from their profile
*Extrapolated or split from raw data variables
Here are the features visualized using Donuts instead of Treemaps. Which do you prefer?
Bias:
The biggest indicator that this sample does not meet the statistical criteria for independent random sampling is the state/country feature. OKCupid was founded in 2004. It’s simply not possible that by 2012 all of their users would only be from the state of California. When you get a dataset, regardless of what you’ve been told about the quality of the sampling, always check for signs of bias. The process of checking for bias in a study or in a sample is sometimes called a “Risk of Bias Assessment”.
Even though the sample looks like it’s heavily biased, we will still draw inference about what is represented in the sample.
The charts tell us that the typical profile on OKCupid back in 2012 was:
- not fat or skinny
- has drinks socially
- doesn’t do drugs
- finished college
- white ethnicity
- varied in terms of possible job background
- doesn’t have kids
- straight
- male
- doesn’t smoke
- single
- lives in San Francisco, California
- eats anything
- agnostic or atheist
- likes dogs and/or cats but doesn’t have them
- not multiracial
- speaks only one language
It’s possible that people misrepresent themselves on their profile, paint themselves more positively, and carefully omit negative information.
Top Spoken Languages
import seaborn as sns

lang_percent = []
for language in languages:
    lang_percent.append((language, df[language].value_counts(normalize = True).loc[1]))

def sort_func(pair):
    return pair[1]
sorted_lang_percent = sorted(lang_percent, key = sort_func, reverse = True)

#Make barplot
plt.figure(figsize = (16, 9))
rects = sns.barplot(x = [each[1] for each in sorted_lang_percent[:10]],
            y = [each[0].title() for each in sorted_lang_percent[:10]],
            orient = 'h',
            palette = "tab20")

#Add Data Labels outside of bar
rect_labels = []
for rect in rects.patches:
    yloc = rect.get_y() + rect.get_height() / 2
    label = plt.annotate(format(rect.get_width(), '.1%'), xy=(rect.get_width(), yloc), xytext=(4, 0),
                         textcoords="offset points", horizontalalignment='left', verticalalignment='center',
                         color='black', clip_on=True)
    rect_labels.append(label)

plt.title("Top 10 Languages")
plt.ylabel("Language")
plt.xlabel('% of users who speak it'.title())
plt.show()

Everyone speaks English. Hilariously some people speak C++… why not Python?
Unfilled Optional Fields Sorted
sorted_nulls = sorted(nulls, reverse = True)
sample_size = 59946

#Make barplot
plt.figure(figsize = (16, 9))
rects = sns.barplot(x = [each[0]/sample_size for each in sorted_nulls[:23]],
            y = [each[1].title() for each in sorted_nulls[:23]],
            orient = 'h',
            palette = "tab20")

#Add Data Labels outside of bar
rect_labels = []
for rect in rects.patches:
    yloc = rect.get_y() + rect.get_height() / 2
    label = plt.annotate(format(rect.get_width(), '.2%'), xy=(rect.get_width(), yloc), xytext=(4, 0),
                         textcoords="offset points", horizontalalignment='left', verticalalignment='center',
                         color='black', clip_on=True)
    rect_labels.append(label)

plt.title("Unfilled Optional Fields")
plt.ylabel("Fields")
plt.xlabel('% of users who did not give information'.title())
plt.show()

Disclaimer: My comments below are pure speculation and hypothesis
| Feature | Hypothesis For Not Sharing Information |
|---|---|
| Income | If you’re rich you don’t want the IRS to know. If you’re poor, you don’t want potential matches to see that either |
| Children | Finding out someone has kids can be a turn off and perceived as extra baggage |
| Diet | People are afraid of being criticized for choosing to shun some foods |
| Religion | Some people are xenophobic. As a result, some people hide their religion so as not to immediately turn away those xenophobes |
| Pets | No idea why a third of users don’t share this information |
| Essays | There’s a pattern where the higher up the chart you go, the higher the essay number. This is because the questions are presented to the user in a fixed order. Not all users have the patience to answer questions all the way to the last one. The reason why essay 8 stands out significantly more than the rest is because the question being asked is “Share something private”, which of course is rather controversial considering you can’t take back what you share online. See below section for the essay questions. |
| Drugs | Drugs are illegal in some states |
Essay Questions
The essay questions are a perfect candidate for Natural Language Processing (NLP) Topic Modelling. More specifically, we’ll be using term frequency - inverse document frequency (tf-idf), a model which initially counts the occurences of each word, then applies a word weighting scheme which deprioritizes common words such as “the”. The expected result is to condense the essay answers into keywords, which may be visualized.
Let’s create a copy of all the essay answers, just in case we need to start over in the preprocessing for NLP.
nlp_essay_df = df[essay_feats].copy(deep = True)
Text Preprocessing
Before we can apply tf-idf to our essay questions, we need to convert them to a suitable format. The process is called text preprocessing. The words of our essay questions will be converted to their root words(also called lemma).
import nltk
from nltk.stem import WordNetLemmatizer
from nltk.corpus import wordnet as wn

from collections import Counter
import unicodedata
import string

# Lemmatizer class object - converts tokens to root words
lemmatizer = WordNetLemmatizer()
# Fetch nltk stopwords
stopwords = nltk.corpus.stopwords.words('english')

def preprocess_corpus(DataFrame, Series):
    # Remove accents function
    def remove_accents(data):
        return ''.join(x for x in unicodedata.normalize('NFKD', data) if x in string.ascii_letters or x == " ")

    # Look at synonyms of the word if it's likely to be a noun, verb, adjective, or adverb
    def get_part_of_speech(word):
        # Fetch synonyms of word from wordnet database
        probable_part_of_speech = wn.synsets(word)
        # Count the number of nouns, verbs, adjectives, and adverbs among the synonyms
        pos_counts = Counter()
        pos_counts["n"] = len(  [ item for item in probable_part_of_speech if item.pos()=="n"]  )
        pos_counts["v"] = len(  [ item for item in probable_part_of_speech if item.pos()=="v"]  )
        pos_counts["a"] = len(  [ item for item in probable_part_of_speech if item.pos()=="a"]  )
        pos_counts["r"] = len(  [ item for item in probable_part_of_speech if item.pos()=="r"]  )
        # Get the speech type with the highest count and return it
        most_likely_part_of_speech = pos_counts.most_common(1)[0][0]
        return most_likely_part_of_speech

    # Convert each word into its lemma(root word)
    def preprocess_text(text, min_word_length):
        # Tokenize
        tokens = nltk.word_tokenize(text)
        # Convert to lowercase
        tokens = [token.lower() for token in tokens]
        # Remove accents
        tokens = [remove_accents(token) for token in tokens]
        # Remove punctuations
        tokens = [str(token).translate(string.punctuation) for token in tokens]
        tokens = [token for token in tokens if token != '']
        # Remove stopwords
        tokens = [token for token in tokens if token not in stopwords]
        # Remove short words
        tokens = [token for token in tokens if len(token) >= min_word_length]
        # Lemmatize
        lemmas = " ".join([lemmatizer.lemmatize(token, get_part_of_speech(token)) for token in tokens])
        return lemmas

    # Convert Data Series to a List
#   list_corpus = DataFrame[Series].dropna().to_list()
    list_corpus = DataFrame[Series].to_list()
    # Remove linebreaks
    list_corpus = [" ".join(text.splitlines(False)) if isinstance(text, str) else ' ' for text in list_corpus ]
    # Remove '/' characters
    list_corpus = [text.replace('/', ' ') if isinstance(text, str) else ' ' for text in list_corpus]
    #Normalize
    processed_corpus = [preprocess_text(text, 3) if isinstance(text, str) else ' ' for text in list_corpus]
    return processed_corpus
Term Frequency-Inverse Document Frequency
Now that we have our root words, let’s apply tf-idf. It will assign a score to each root word. For each user’s answer we will get the highest scoring word, our keyword. This keyword represents what our model believes is the most significant word of a user’s response.
from sklearn.feature_extraction.text import TfidfVectorizer

# Tfidf class object - Scores each word
vectorizer = vectorizer = TfidfVectorizer()

def tfidf_for_keywords(processed_corpus):
    '''Generates one keyword for each document in the corpus. Returns all keywords as a list.'''
    tfidf_scores = vectorizer.fit_transform(processed_corpus)
    feature_names = vectorizer.get_feature_names()
    keywords = [feature_names[row.argmax()] for row in tfidf_scores]
    return keywords, tfidf_scores, feature_names
Iterate over all essay columns
Let’s iterate the whole process over all our essay features, and let’s collect only the most common keywords.
essay_vectors = []
essay_feature_names = []
def series_to_keywords(DataFrame, Series, n_top, export_vectors = False):
    processed_corpus = preprocess_corpus(DataFrame, Series)
    keywords, tfidf_scores, feature_names = tfidf_for_keywords(processed_corpus)
    essay_vectors.append(tfidf_scores)
    essay_feature_names.append(feature_names)
#   temp = DataFrame[Series].dropna().reset_index()
    temp = DataFrame[Series].reset_index()
    temp[str(Series) + '_keywords'] = keywords
    if export_vectors:
        temp[str(Series) + '_keywords'].value_counts().iloc[:n_top].to_csv(str(Series) + '_top_keys.csv')

# Training NLP Model commented out due to long training time
# for feature in essay_feats:
#     series_to_keywords(nlp_essay_df, feature, 40)
Top Keywords in User Responses to Essay Questions Visualized as Wordclouds
Let’s generate wordclouds for each of the essay questions.
Developer Note: The code was run in a separate Python 3.7 environment to avoid conflicts with other installed packages.
import numpy as np
import matplotlib.pyplot as plt
from wordcloud import WordCloud
import csv

essay_feats = ['essay0','essay1','essay2','essay3','essay4',
               'essay5','essay6','essay7','essay8','essay9']
essay_questions = ['Describe yourself',
                  'What are you currently doing?',
                  'What are you good at?',
                  'Describe yourself physically',
                  'What are your favorite books, movies, tv shows, music, food, etc?',
                  "You cannot live without...",
                  'What do you think about?',
                  'What is a typical friday night for you?',
                  'Share something private',
                  'You would like me if...']

#Fetch data from csv files
essay_feats_dicts = []
for feat in essay_feats:
    with open(feat + '_top_keys.csv', newline='') as csv_file:
        feat = {}
        dict_obj = csv.DictReader(csv_file, fieldnames = ['keyword', 'count'])
        next(dict_obj)
        for row in dict_obj:
            if not((row['keyword'] == 'aa') or  (row['keyword'] == 'aaa')):
                feat[row['keyword']] = int(row['count'])
        essay_feats_dicts.append(feat)

#Generate wordclouds
plt.figure(figsize = (16,24))
for each, quest, feat in zip(essay_feats_dicts, essay_questions, essay_feats):
    wc = WordCloud(background_color="white", repeat= False)
    wc.generate_from_frequencies(each)
    plt.subplot(5, 2, essay_questions.index(quest) + 1)
    plt.axis("off")
    plt.imshow(wc, interpolation="bilinear")
    plt.title(feat + ': ' + quest.title(), fontsize = 12)
plt.subplots_adjust(hspace=0, wspace = 0.1)
plt.savefig('essay_wordclouds.png')
plt.show()
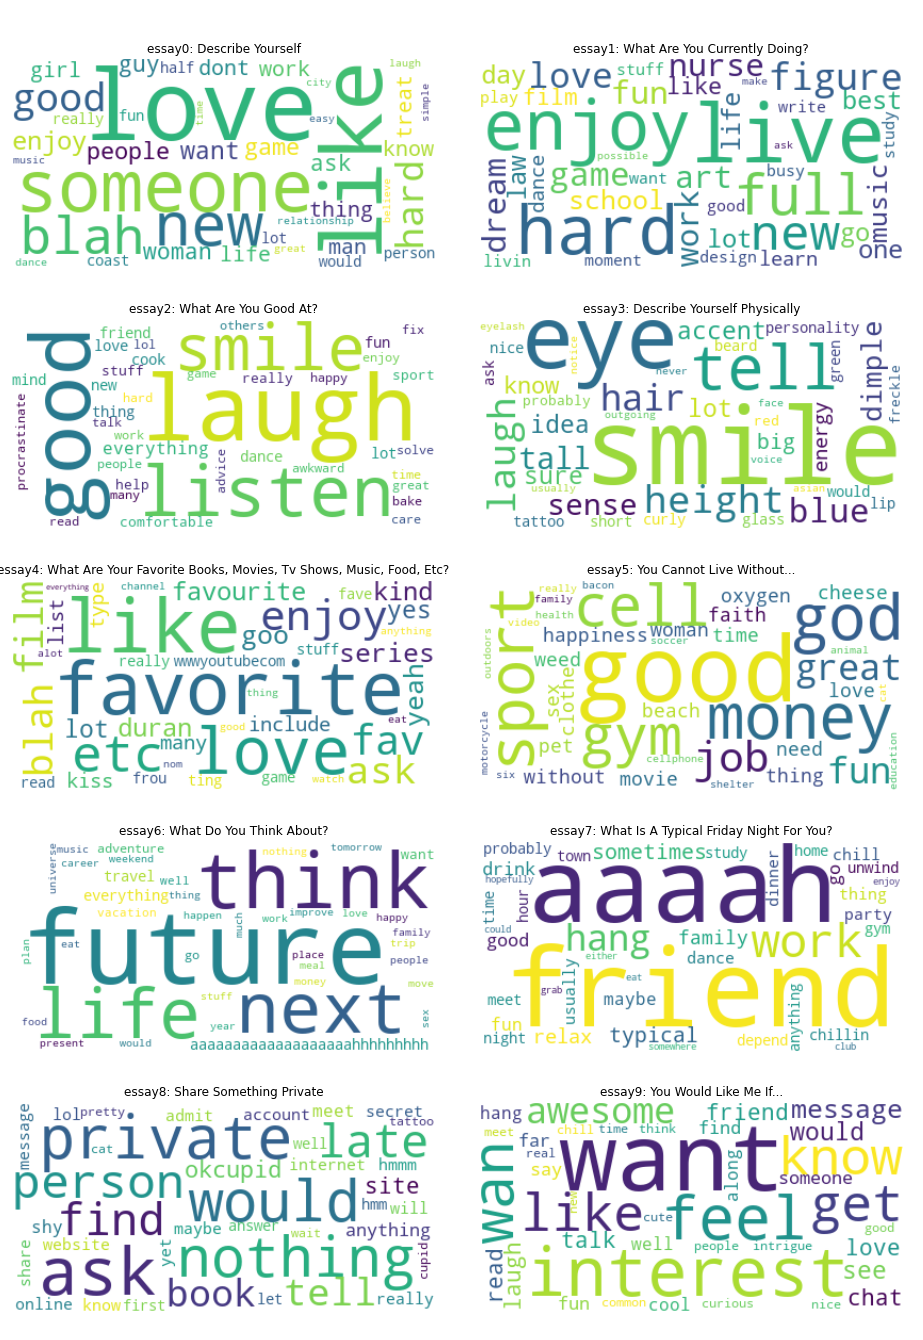
The level of insight gained from each wordcloud, using the existing model algorithm, is not the same. Some give sufficiently interesting and useful results. Some tell us more about what essay question is being asked rather than what the answers to those questions are. The results merit further filtering, tweaking, and refinement of the algorithm to give us better keywords. Further NLP modelling and analysis deserves to be discussed in its own lengthy separate article/notebook. We will not explore it further here.
In addition to the wordclouds, manual reading of several user responses was done to better interpret the tf-idf results.
Interpretation of tf-idf Results
| Essay Number | Personal best guess of the question asked | Comment on tf-idf Result |
|---|---|---|
| essay 0 | Describe yourself | Users use this essay question to talk about what they like, love, and the qualities of who(someone) they’re looking for |
| essay 1 | What are you currently doing? | A lot of the smaller words are clear answers to the question while the biggest words are a little bit more difficult to interpret or could be weighted to have a lower score |
| essay 2 | What are you good at? | Users say they’re good at listening and that they have a great smile and laugh |
| essay 3 | Describe yourself physically | Users talk about their eyes, hair, smile, and height |
| essay 4 | What are your favorite books, movies, tv shows, music, food, etc | Not a very meaningful result. More useful for guessing the essay question. |
| essay 5 | You can’t live without… | Users cannot live without their cellphone, money, gym, job, god, sports, fun. Not sure though what it means that ‘good’ is top keyword |
| essay 6 | What do you think about? | Users think about life and the future |
| essay 7 | What is a typical friday night for you? | Users are with their friends on friday nights |
| essay 8 | Share something private | Users say ‘message/ask me about private things and ill share it with you, but I won’t share it here on my public profile’. From the previous section, we can also see that this is the least answered essay question. |
| essay 9 | You would like me if… | Doesn’t seem like a very meaningful result |
Further NLP Practice
There is still additional NLP analysis that we will not explore here but can definitely be applied. For example, we can see in essay0 the top keywords are ‘love’ and ‘like’. What do users really mean when they use the word ‘love’? Is it ‘making love’ or ‘looking for love’? Are they using ‘love’ and ‘like’ interchangeably?
Additional NLP:
- Filter keywords by Part of Speech (noun, adjective, verb, adverb)
- Contextualize keywords by investigating the words which follow and precede them
- Make use of n-grams instead of one-word terms. The terms in our tf-idf model are one word long, but we can also use pairs of words, or groups of three words, and even more. You could also try skip-grams.
- Make use of other Word Embedding Models, AI models that map words into vectors. Tf-idf was only one example of a simple word embedding model. Each element of the vector could be different properties of the word, such as its part of speech, number of syllables, number of vowels, number of consonants, what word follows it, what word precedes it, location of the word in the paragraph, and much more.
- Input the tf-idf results to a Latent Dirichlet Allocation (LDA) Model. Manually assign labels to your LDA topics. Plot the most common topics in the corpus, as well as the most common words per topic, from your LDA result.
Visualization Recap
In this section, we visualized the following:
- We visualized our numerical features using box plots and histograms.
- We made an interactive treemap of our categorical features.
- We visualized our categorical features using donut plots.
- Using bar plots we visualized the top spoken languages and top unfilled optional fields among user profiles.
- We visualized the essay question responses using Natural Language Processing and wordclouds.
- We discovered that our sample has a high risk of bias. In our sample data which is dated from 2012, although OKCupid was founded in 2004, almost everyone lives in California and half of that in the City of San Francisco.
- We removed the outliers of
ageandheight.
Bonus Section: Wrangling for Machine Learning
We need to do more data wrangling before we go into Machine Learning. All our features have to be properly formatted and expanded/encoded. Any value that is not a number will not be understood by ML training algorithms.
We’ll backup our data at this point. Let’s also drop our languages sparse matrix. Previously we didn’t include the fluency descriptors in our sparse matrix for our visualization. Later, when one-hot encoding, we will make a new sparse matrix for languages which contains the fluency descriptors.
expanded_df_backup = df.drop(columns = languages).copy(deep = True)
df = expanded_df_backup.copy(deep=True)
Let’s convert last_online from a string to a datetime format and split it up.
df['last_online'] = pd.to_datetime(df.last_online, format = "%Y-%m-%d-%H-%M")
df['last_online_year'] = df.last_online.dt.year
df['last_online_month'] = df.last_online.dt.month
df['last_online_day'] = df.last_online.dt.day
df['last_online_hour'] = df.last_online.dt.hour
Let’s drop columns that we have created splits from. If we need to use them as target variables for prediction we can recover any of them from our backup dataframe. Let’s drop income because 80% of users have not shared their information. Let’s also drop num_ethnicities and optional__%unfilled.
df = df.drop(columns = ['diet', 'location', 'offspring', 'religion', 'sign', 'pets', 'income', 'last_online',
                        'num_ethnicities', 'optional_%unfilled'])
Let’s apply one-hot encoding to our categorical variables. We will also encode a category to represent the null values of each feature, so that our ML model will consider the user’s decision to fill or leave blank an optional field when making predictions.
print('Before one-hot encoding:')
df.info()
Before one-hot encoding:

<class 'pandas.core.frame.DataFrame'>
Int64Index: 59811 entries, 0 to 59945
Data columns (total 42 columns):
 #   Column              Non-Null Count  Dtype
---  ------              --------------  -----
 0   age                 59811 non-null  int64
 1   body_type           54538 non-null  object
 2   drinks              56846 non-null  object
 3   drugs               45755 non-null  object
 4   education           53211 non-null  object
 5   essay0              54351 non-null  object
 6   essay1              52275 non-null  object
 7   essay2              50210 non-null  object
 8   essay3              48375 non-null  object
 9   essay4              49318 non-null  object
 10  essay5              49010 non-null  object
 11  essay6              46085 non-null  object
 12  essay7              47404 non-null  object
 13  essay8              40636 non-null  object
 14  essay9              47245 non-null  object
 15  ethnicity           54159 non-null  object
 16  height              59811 non-null  float64
 17  job                 51641 non-null  object
 18  orientation         59811 non-null  object
 19  sex                 59811 non-null  object
 20  smokes              54320 non-null  object
 21  speaks              59761 non-null  object
 22  status              59811 non-null  object
 23  diet_adherence      35481 non-null  object
 24  diet_type           35481 non-null  object
 25  city                59811 non-null  object
 26  state/country       59811 non-null  object
 27  offspring_want      24334 non-null  object
 28  offspring_attitude  9711 non-null   object
 29  religion_type       39631 non-null  object
 30  religion_attitude   39631 non-null  object
 31  sign_type           48787 non-null  object
 32  sign_attitude       48787 non-null  object
 33  dog_preference      28880 non-null  object
 34  cat_preference      21293 non-null  object
 35  has_dogs            39931 non-null  float64
 36  has_cats            39931 non-null  float64
 37  num_languages       59811 non-null  int64
 38  last_online_year    59811 non-null  int64
 39  last_online_month   59811 non-null  int64
 40  last_online_day     59811 non-null  int64
 41  last_online_hour    59811 non-null  int64
dtypes: float64(3), int64(6), object(33)
memory usage: 19.6+ MB
df = pd.get_dummies(df, columns = ['body_type', 'drinks', 'drugs', 'education', 'job', 'orientation', 'sex',
                                           'smokes', 'status', 'diet_adherence', 'diet_type', 'city', 'state/country',
                                           'offspring_want', 'offspring_attitude', 'religion_type', 'religion_attitude',
                                           'sign_type', 'sign_attitude', 'dog_preference', 'cat_preference', 'has_dogs',
                                           'has_cats',],
                    sparse=True,
                    dummy_na=True)

df.rename(columns = {'sex_m':'sex'}, inplace = True)
df = df.drop(columns = ['sex_f'])

def string_dummies(df, series, sep):
    if df[series].isna().any():
        df[series + '_nan'] = df[series].isna().astype('int64')
    temp_df = df[series].str.get_dummies(sep).add_prefix(str(series) + '_')
    df = pd.concat([df, temp_df], axis = 1)
    return df.drop(columns = [str(series)])

selection = ['ethnicity', 'speaks']
sep_list = [', ', ', ']
for series, sep in zip (selection, sep_list):
    df = string_dummies(df, series, sep)
print('After one-hot encoding:')
df.info()
After one-hot encoding:

<class 'pandas.core.frame.DataFrame'>
Int64Index: 59811 entries, 0 to 59945
Columns: 737 entries, age to speaks_yiddish (poorly)
dtypes: Sparse[uint8, 0](407), float64(1), int64(319), object(10)
memory usage: 157.5+ MB
Let’s make our dataframe have uniform datatypes. Just ignore the datatype of the essays for now (the ten object columns).
df['height'] = df.height.astype('int64')
for each in df.select_dtypes(include=['int64']).columns.to_list():
    df[each] = pd.arrays.SparseArray(df[each].values, dtype='uint8')
df.info()
<class 'pandas.core.frame.DataFrame'>
Int64Index: 59811 entries, 0 to 59945
Columns: 737 entries, age to speaks_yiddish (poorly)
dtypes: Sparse[uint8, 0](727), object(10)
memory usage: 14.3+ MB
Our data is now ready for machine learning algorithms.
Wrangling for Machine Learning Recap
In this Section we accomplished the following:
- Converted
last_onlineinto datetime format and split it up by hour, day, year, month - Dropped columns that, for various reasons, we will not include in the Machine Learning Section
- Applied one-hot encoding to our categorical features
- Converted the datatypes of our dataframe to become uniform, specifically they are now
Sparse[uint8, 0]
We’re done with exploring data. On to Machine Learning!
The continuation of this project is in the following articles which can be read in any order:
Gender Classification with OKCupid Data
Dating Pools using K-Means Clustering